

Ten economic and market developments to be grateful for this holiday season
- 11.20.26
- Markets & Investing
- Commentary
Review the latest Weekly Headings by CIO Larry Adam.
Key takeaways:
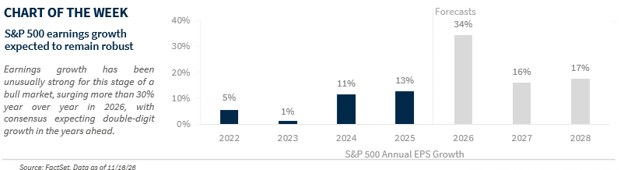
- S&P 500 earnings growth has been a powerful tailwind for equities
- Higher Treasury yields have restored income to fixed income portfolios
- US economic growth remains strong, fueled by the consumer and AI investment
Despite a few twists and turns, economic resilience and encouraging market trends have provided investors with many reasons to be thankful. In the holiday spirit, we’ve gathered the top ten economic and market developments that made our gratitude list.
One economy that defies expectations
The US economy is on track to grow more than 2% in every quarter this year, fueled by resilient consumer spending, a solid labor market and robust business investment driven by the AI buildout. This sustained strength has propelled the economic expansion well into its sixth year (approximately 80 months), surpassing the post-WWII historical average of 5.5 years.
Jobless claims below 200,000
The US labor market has remained remarkably resilient, with weekly initial jobless claims hovering near historic lows and reaching a 57-year low in July 2026. More recently, claims have held at or below 200,000 for nine straight weeks, underscoring the low-hire, low-fire dynamic that has kept layoffs subdued and unemployment near 4%.
S&P 500 earnings growth above 30%
Strong corporate earnings growth has been a powerful tailwind for US equities, with consensus estimates pointing to more than 30% year-over-year S&P 500 earnings growth in 2026. While technology has been a major driver, earnings strength has broadened across sectors, reinforcing the fundamental foundation of the ongoing bull market.
Fourth year of the current bull market
The S&P 500 bull market turned four years old in October, with its 105% price return exceeding the historical average of approximately 90% at this stage. A hopeful year-end rally could still deliver a fourth straight year of double-digit returns, a feat not seen since the late 1990s. Encouragingly, strong fundamentals continue to underpin the rally, as earnings growth has outpaced stock price appreciation, making valuations more attractive even as the market climbs.
Fixed income yields near or above 5%
After years of historically low rates, fixed income is now offering something investors haven’t enjoyed in nearly two decades: yields near or above 5%. These attractive yields have restored meaningful income to portfolios, strengthened fixed income’s role in asset allocation, and reduced the need to take on additional risk to generate compelling returns.
Retail sales growing above 6%
Despite persistent inflation, US consumers continue to spend. Retail sales, unadjusted for inflation, climbed more than 6% year over year in October, their strongest pace since 2023. Real-time indicators, including hotel occupancy, restaurant bookings and department store spending, highlight this resilience and the consumer’s vital role in driving economic growth.
AI investment tops $700 billion
The AI revolution has unleashed a powerful wave of capital spending. AI-related spending by major hyperscalers is on pace to exceed $790 billion this year, nearly double 2025’s level, driving demand for semiconductors, data centers, power infrastructure and software. Beyond boosting earnings and economic activity, this unprecedented buildout could deliver an even greater prize: higher productivity and stronger long-term economic growth.
Investment-grade spreads in the 80s
Despite more than $2 trillion in new investment-grade issuance in 2026 and historically tight spreads, strong earnings and robust investor demand have kept credit spreads contained. With spreads in the 80s most of the year and all-in yields near 6%, healthy corporate balance sheets and attractive income opportunities continue to support investment grade credit.
S&P 500 dividend growth at 9%
Strong corporate earnings and cash flows continue to reward shareholders. In 2026, S&P 500 companies have increased dividends by approximately 9%, the fastest pace since 2018 and well above the 6.2% historical average since 2000. This robust dividend growth further underscores the strong fundamental foundation supporting US equities.
S&P 500 Equal Weight Index year-to-date return above 10%
One of the most encouraging developments of this year’s equity gains has been the broadening in market leadership. On a year-to-date basis, the S&P 500 Equal Weight Index is outperforming the market-cap weighted index in price terms for the first time since 2022, and by the widest margin (approximately 6%) since 2022. The strong performance highlights improving market breadth and suggests the bull market is being supported by a larger share of companies, not just a handful of mega-cap tech names.
Source: FactSet. Data as of 11/18/26
Source: FactSet. Data as of 11/18/26
All expressions of opinion reflect the judgment of the author(s) and the Investment Strategy Committee and are subject to change. This information should not be construed as a recommendation. The foregoing content is subject to change at any time without notice. Content provided herein is for informational purposes only. There is no guarantee that these statements, opinions or forecasts provided herein will prove to be correct. Past performance is not a guarantee of future results. Indices and peer groups are not available for direct investment. Any investor who attempts to mimic the performance of an index or peer group would incur fees and expenses that would reduce returns. No investment strategy can guarantee success.
Economic and market conditions are subject to change. Investing involves risks including the possible loss of capital.
The information has been obtained from sources considered to be reliable, but we do not guarantee that the foregoing material is accurate or complete. Diversification and asset allocation do not ensure a profit or protect against a loss.
The S&P 500 Total Return Index: The index is widely regarded as the best single gauge of large-cap U.S. equities. There is over USD 7.8 trillion benchmarked to the index, with index assets comprising approximately USD 2.2 trillion of this total. The index includes 500 leading companies and captures approximately 80% coverage of available market capitalization.
Sector investments are companies focused on a specific economic sector and are presented here for illustrative purposes only. Sectors, including technology, are subject to varying levels of competition, economic sensitivity, and political and regulatory risks. Investing in any individual sector involves limited diversification.
